
|
CoreLogic: House Prices up 12.2% Year-over-year in May Home prices nationwide, including distressed sales, increased 12.2 percent on a year-over-year basis in May 2013 compared to May 2012. This change represents the biggest year-over-year increase since February 2006 and the 15th consecutive monthly increase in home prices nationally. On a month-over-month basis, including distressed sales, home prices increased by 2.6 percent in May 2013 compared to April 2013. Excluding distressed sales, home prices increased on a year-over-year basis by 11.6 percent in May 2013 compared to May 2012. On a month-over-month basis, excluding distressed sales, home prices increased 2.3 percent in May 2013 compared to April 2013. Distressed sales include short sales and real estate owned (REO) transactions. The CoreLogic Pending HPI indicates that June 2013 home prices, including distressed sales, are expected to rise by 13.2 percent on a year-over-year basis from June 2012 and rise by 2.9 percent on a month-over-month basis from May 2013. Excluding distressed sales, June 2013 home prices are poised to rise 12 percent year over year from June 2012 and by 2 percent month over month from May 2013. “It’s been more than seven years since the housing market last experienced the increases that we saw in May, with indications that the summer months will continue to see significant gains,” said Dr. Mark Fleming, chief economist for CoreLogic. “As we approach the half-way point of 2013, home prices continue to respond positively to the reductions in home inventory thus far.”
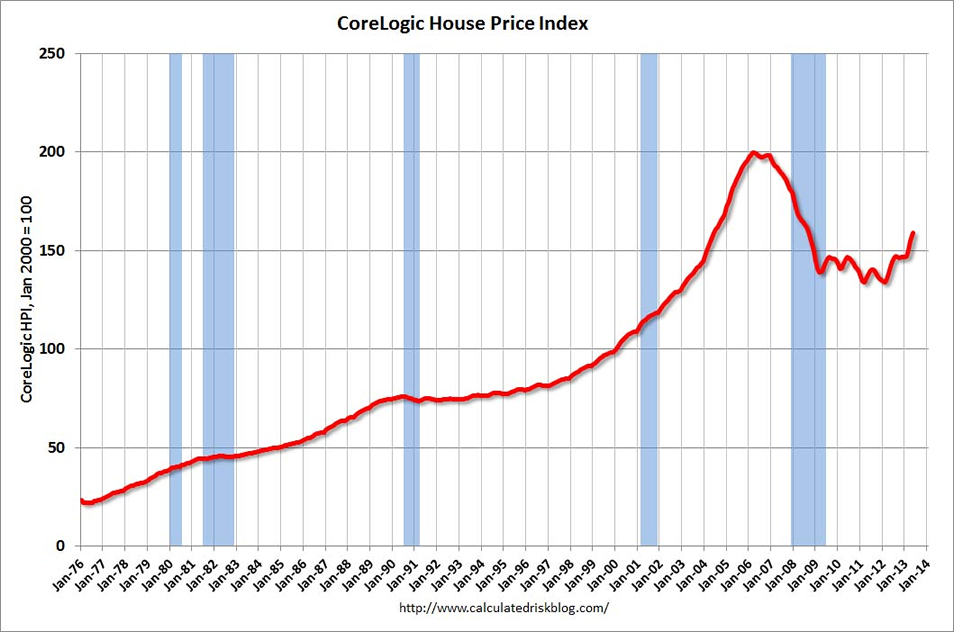
This graph shows the national CoreLogic HPI data since 1976. January 2000 = 100. The index was up 2.6% in May, and is up 12.2% over the last year. This index is not seasonally adjusted, and this is usually the strongest time of the year for price increases. The index is off 21% from the peak - and is up 18.7% from the post-bubble low set in February 2012.
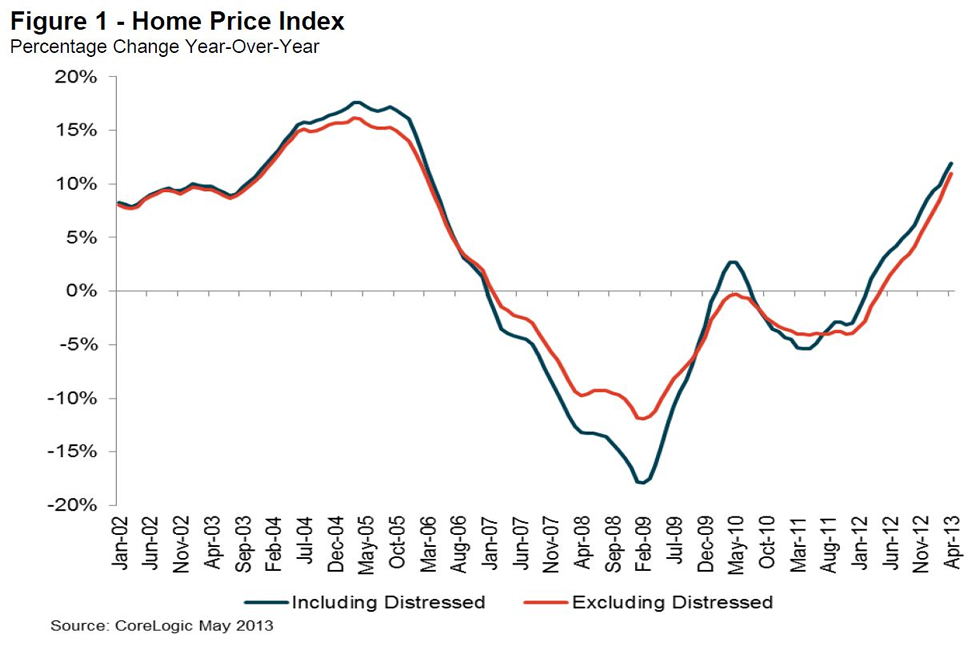
CoreLogic YoY House Price IndexThe second graph is from CoreLogic. The year-over-year comparison has been positive for fifteen consecutive months suggesting house prices bottomed early in 2012 on a national basis (the bump in 2010 was related to the tax credit). This is the largest year-over-year increase since 2006. This was another very strong month-to-month increase. Note: CoreLogic notes that prices are up year-over-year in all 50 states excluding distressed sales, and up in 97 of the 100 largest metro areas: "Of the top 100 Core Based Statistical Areas (CBSAs) measured by population, 97 were showing year-over-year increases in May, up from 94 in April 2013."
|
| © 2006 - 2022. All Rights Reserved. |