|
S&P/CASE-SHILLER Home Price Index Increased 5% Year-Over-Year The S&P/Case-Shiller U.S. National Home Price Index, covering all nine U.S. census divisions, reported a 5.0% annual gain in April, down from 5.1% the previous month. The 10-City Composite posted a 4.7% annual increase, down from 4.8% in March. The 20-City Composite reported a year-over-year gain of 5.4%, down from 5.5% from the prior month. Portland, Seattle, and Denver reported the highest year-over-year gains among the 20 cities with another month of annual price increases. Portland led the way with a 12.3% year-over-year price increase, followed by Seattle at 10.7%, and Denver with a 9.5% increase. Nine cities reported greater price increases in the year ending April 2016 versus the year ending March 2016.
MONTH-OVER-MONTH Before seasonal adjustment, the National Index posted a month-over-month gain of 1.0% in April. The 10-City Composite recorded a 1.0% month-over-month increase, while the 20-City Composite posted a 1.1% increase in April. After seasonal adjustment, the National Index recorded a 0.1% month-over-month increase, the 10-City Composite posted a 0.3% increase, and the 20-City Composite reported a 0.5% month-over-month increase. After seasonal adjustment, 15 cities saw prices rise, two cities were unchanged, and three cities experienced negative monthly prices changes.
ANALYSIS ”The housing sector continues to turn in a strong price performance with the S&P/Case-Shiller National Index rising at a 5% or greater annual rate for six consecutive months,” says David M. Blitzer, Managing Director and Chairman of the Index Committee at S&P Dow Jones Indices. “The home price increases reflect the low unemployment rate, low mortgage interest rates, and consumers’ generally positive outlook. One result is that an increasing number of cities have surpassed the high prices seen before the Great Recession. Currently, seven cities – Denver, Dallas, Portland OR, San Francisco, Seattle, Charlotte, and Boston – are setting new highs. “However, the outlook is not without a lot of uncertainty and some risk. The details in the S&P/Case-Shiller Home Price data also hint at possible softness. Seasonally adjusted figures in the report show that three cities saw lower prices in April compared to only one city in March. Among the 20 cities, 16 saw either declines or smaller increases in monthly prices in the seasonally adjusted numbers.”
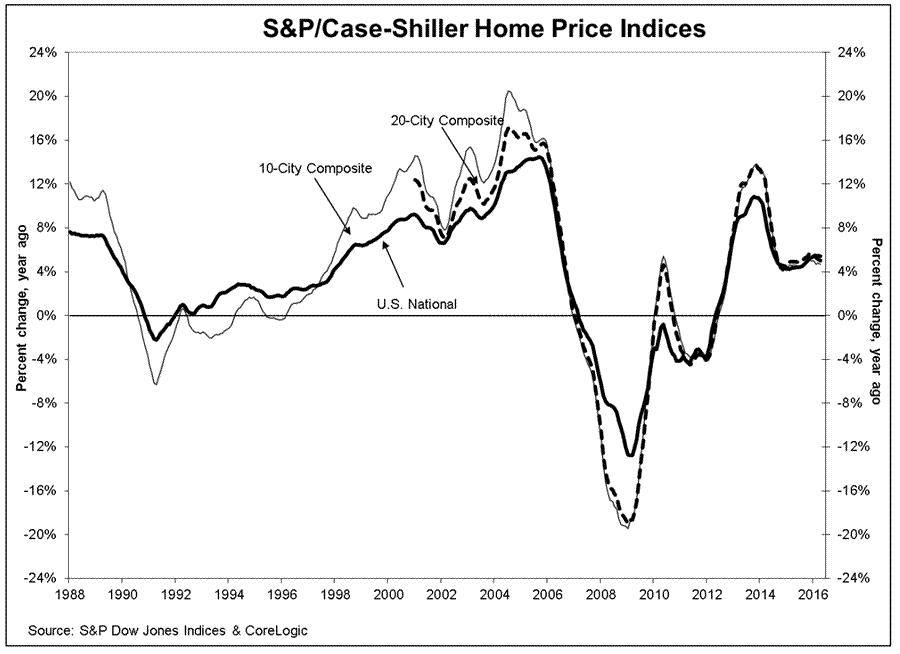
The chart below depicts the annual returns of the U.S. National, the 10-City Composite, and the 20-City Composite Home Price Indices. The S&P/Case-Shiller U.S. National Home Price Index, which covers all nine U.S. census divisions, recorded a 5.0% annual gain in April 2016. The 10-City and 20-City Composites reported year-over-year increases of 4.7% and 5.4%.
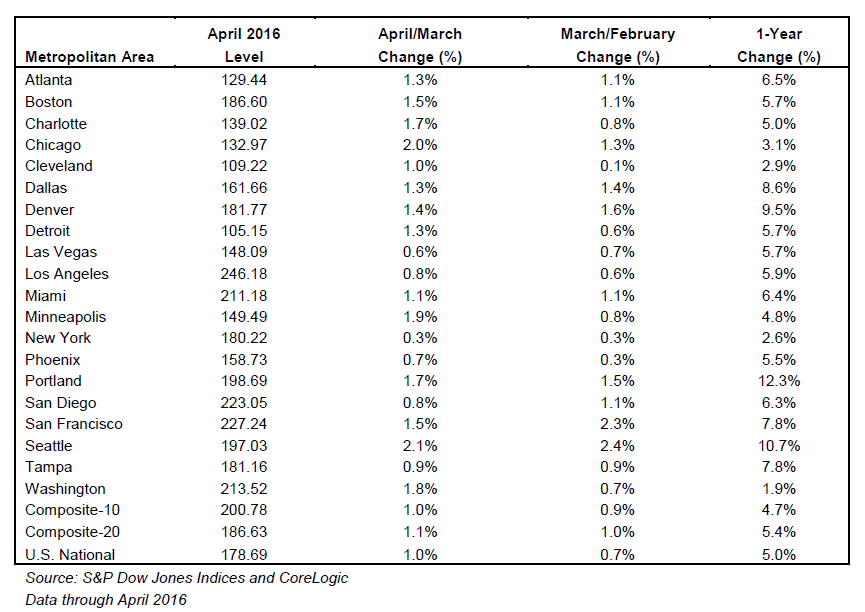
Table 1 below summarizes the results for April 2016. The S&P/Case-Shiller Home Price Indices are revised for the prior 24 months, based on the receipt of additional source data.
|
| © 2006 - 2022. All Rights Reserved. |

