
|
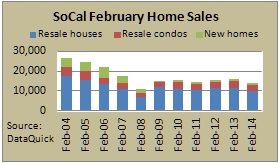
Southern California February Home Sales Lowest Since 2008 Southland home sales dropped to the lowest level for a February in six years as many would-be buyers struggled with inventory constraints, credit hurdles and reduced affordability. The median price paid for a home edged up slightly from January and remained nearly 20 percent higher than a year earlier, a real estate information service reported. A total of 14,027 new and resale houses and condos sold in Los Angeles, Riverside, San Diego, Ventura, San Bernardino and Orange counties last month. That was down 3.1 percent from 14,471 in January, and down 12.0 percent from 15,945 sales in February 2013, according to San Diego-based DataQuick.
On average, sales have increased 0.7 percent between January and February since 1988, when DataQuick’s statistics begin. February sales have ranged from a low of 10,777 in 2008 to a high of 26,587 in 2004. Last month’s Southland sales were 20.1 percent below the average number of sales – 17,560 – for February since 1988. Sales haven’t been above average for any particular month in more than seven years. “February was another month with lackluster home sales, and the fifth in a row where sales fell short of the same month a year earlier. The March-through-May data will give us a better sense of what's been holding back activity the most – supply constraints or the double-whammy of higher prices and higher mortgage rates. The drop in housing affordability is enough to nudge some out of the market. Other would-be buyers have no doubt called ‘time out’ while re-evaluating their housing priorities, or watching for signs the market has overshot a sustainable price level,” said John Walsh, DataQuick president. “But there’s still reason to expect significant pressure on the market,” he added. “The economy is growing, creating jobs. People who lost homes to a short sale or foreclosure over the last eight years will be looking to buy again. On the supply side, inventory is increasing, as it normally does this time of year, but so far there hasn’t been an explosion of new listings, and new-home construction is still well below average.” The median price paid for all new and resale houses and condos sold in the six-county region last month was $383,000, up 0.8 percent from $380,000 in January and up 19.7 percent from $320,000 in February 2013. The Southland’s median price held at or near $385,000 between last June and November, then rose to $395,000 in December, which was the peak for 2013 and the highest for any month since February 2008, when it was $408,000. The median sale price has risen on a year-over-year basis for 23 consecutive months. Those gains have been double-digit – between 10.8 percent and 28.3 percent – over the past 19 months. The February median stood 24.2 percent below the peak $505,000 median in spring/summer 2007. Prices continue to rise at different rates depending on price segment. In February, the lowest-cost third of the region's housing stock saw a 23.2 percent year-over-year increase in the median price paid per square foot for resale houses. The annual gain was 18.7 percent for the middle third of the market and 15.1 percent for the top, most-expensive third. The number of homes sold in many mid-level and high-end areas continued to rise on a year-over-year basis last month, while more affordable markets generally saw less activity than a year earlier. Last month the number of homes that sold from $300,000 through $799,999 – a range that includes many move-up buyers – rose 2.1 percent year-over-year. The number that sold for $500,000 or more increased 12.2 percent from one year earlier, while $800,000-plus sales rose 4.9 percent. In February, 32.6 percent of all Southland home sales were for $500,000 or more, up a tad from a revised 32.2 percent the month before and up from 24.4 percent a year earlier. The number of Southland homes that sold below $200,000 last month dropped 47.0 percent year-over-year, while sales below $300,000 fell 38.7 percent. One of the main reasons for the big decline in lower-end sales is the relatively low supply of homes on the market. Many owners still can’t afford to sell their homes because they owe more than they are worth, and lenders aren’t foreclosing on as many properties, further limiting supply. Foreclosure resales – homes foreclosed on in the prior 12 months – accounted for 6.8 percent of the Southland resale market in February. That was up slightly from 6.6 percent the prior month and was down from 16.2 percent a year earlier. In recent months the foreclosure resale rate has been the lowest since early 2007. In the current cycle, foreclosure resales hit a high of 56.7 percent in February 2009. Short sales – transactions where the sale price fell short of what was owed on the property – made up an estimated 9.4 percent of Southland resales last month. That was down from a revised 11.0 percent the prior month and down from 22.4 percent a year earlier. Absentee buyers – mostly investors and some second-home purchasers – bought 29.0 percent of the Southland homes sold last month, up slightly from 28.2 percent in January and down from 32.3 percent a year earlier. The monthly average since 2000, when the absentee data begin, is 18.6 percent. Last month’s absentee buyers paid a median $320,000, up 25.5 percent year-over-year. In February 6.2 percent of all Southland homes sold on the open market were flipped, meaning they had previously sold in the prior six months. That’s the same flipping rate as the month before and it’s down from a record 7.0 percent a year earlier. (The figures exclude homes resold after being purchased at public foreclosure auctions on the courthouse steps). Buyers paying cash last month accounted for 30.9 percent of home sales, up from 29.1 percent the month before and down from a record 36.9 percent in February last year. Since 1988 the monthly average for cash buyers is 16.4 percent of all sales. Cash buyers paid a median $340,000 last month, up 28.3 percent from a year earlier. In February, Southern California home buyers forked over a total of $3.08 billion of their own money in the form of down payments or cash purchases. That was down from a revised $3.29 billion in January and down from $3.35 billion a year ago. The out-of-pocket total peaked last May at $5.41 billion. While credit conditions remain relatively tight in an historical context, they appear to be easing, especially when compared with a year ago. Last month 12.9 percent of Southland home purchase loans were adjustable-rate mortgages (ARMs) – more than double the ARM level of a year earlier. Last month's figure was down a bit from 13.5 percent in January and up from 5.6 percent in February 2013. The January ARM level was the highest since April 2008, when it was 16.4 percent. Since 2000, a monthly average of about 31 percent of Southland purchase loans have been ARMs. Jumbo loans, mortgages above the old conforming limit of $417,000, accounted for 27.2 percent of last month’s Southland purchase lending. That was up from 26.7 percent the prior month and up from 21.1 percent a year earlier. In the months leading up to the credit crunch that struck in August 2007, jumbos accounted for around 40 percent of the home loan market. All lenders combined provided a total of $3.87 billion in mortgage money to Southern California home buyers in February, down from a revised $4.02 billion in January and up from $3.62 billion in February last year. The most active lenders to Southern California home buyers last month were Wells Fargo with 6.7 percent of the total home purchase loan market, Bank of America with 2.6 percent and JP Morgan Chase with 2.3 percent. Government-insured FHA loans, a popular low-down-payment choice among first-time buyers, accounted for 19.3 percent of all purchase mortgages last month. That was down from 21.1 percent the month before and down from 24.6 percent a year earlier. In recent months the FHA share has been the lowest since early 2008, mainly because of tighter FHA qualifying standards and the difficulties first-time buyers have competing with investors and cash buyers. The typical monthly mortgage payment Southland buyers committed themselves to paying last month was $1,516, down slightly from $1,528 the month before and up from $1,154 a year earlier. Adjusted for inflation, last month’s typical payment was 36.8 percent below the typical payment in the spring of 1989, the peak of the prior real estate cycle. It was 48.2 percent below the current cycle’s peak in July 2007. Indicators of market distress continue to decline. Foreclosure activity remains well below year-ago and far below peak levels. Financing with multiple mortgages is very low, and down payment sizes are stable, DataQuick reported.
|
| © 2006 - 2022. All Rights Reserved. |