|
Home Prices Continued to Decline in November 2011 to New Post-Bubble Lows Data through November 2011, released today by S&P Indices for its S&P/Case-Shiller Home Price Indices, the leading measure of U.S. home prices, showed declines of 1.3% for both the 10- and 20-City Composites in November over October. For a second consecutive month, 19 of the 20 cities covered by the indices also saw home prices decrease. The 10- and 20-City composites posted annual returns of -3.6% and -3.7% versus November 2010, respectively. These are worse than the -3.2% and -3.4% respective rates reported for October. “Despite continued low interest rates and better real GDP growth in the fourth quarter, home prices continue to fall. Weakness was seen as 19 of 20 cities saw average home prices decline in November over October,” says David M. Blitzer, Chairman of the Index Committee at S&P Indices. “... Nationally, home prices are lower than a year ago. The 10-City Composite was down 3.6% and the 20-City was down 3.7% compared to November 2010. The trend is down and there are few, if any, signs in the numbers that a turning point is close at hand.”
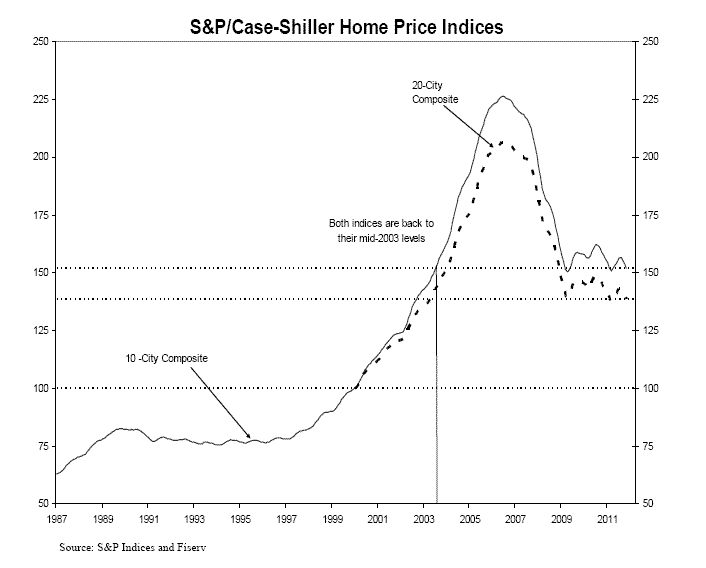
The chart above shows the index levels for the 10-City and 20-City Composite Indices. As of November 2011, average home prices across the United States are back to the levels where they were in mid-2003. Measured from their June/July 2006 peaks through November 2011, the peak-to-current decline for both the 10-City Composite and 20-City Composite is -32.9%. The recovery from recent lows are +1.0% and +0.6%, respectively.
|
| © 2006 - 2022. All Rights Reserved. |
